
Corrosion is the primary threat to the structural integrity of offshore assets. Managing it effectively requires two complementary techniques: cathodic protection (CP) surveys, which confirm that the electrochemical defence system is working; and ultrasonic thickness measurement (UTM) surveys, which directly measure how much steel remains. Run together on a single ROV deployment, they give operators a complete picture that no single technique can provide alone.
Part 1: Cathodic Protection Surveys
Two main CP approaches are used offshore: sacrificial anode systems and impressed current systems. Sacrificial anodes — typically aluminium or zinc alloys — are attached to the structure and corrode preferentially, protecting the steel. Impressed current systems use an external power source to drive protective current through the structure.
The effectiveness of either system is measured by the potential difference between the structure and a reference electrode. For steel in seawater, a potential of -800 mV to -1050 mV (vs Ag/AgCl) indicates adequate protection. Values more positive than -800 mV suggest under-protection; values more negative than -1050 mV risk hydrogen embrittlement.
Conducting a CP Survey with an ROV
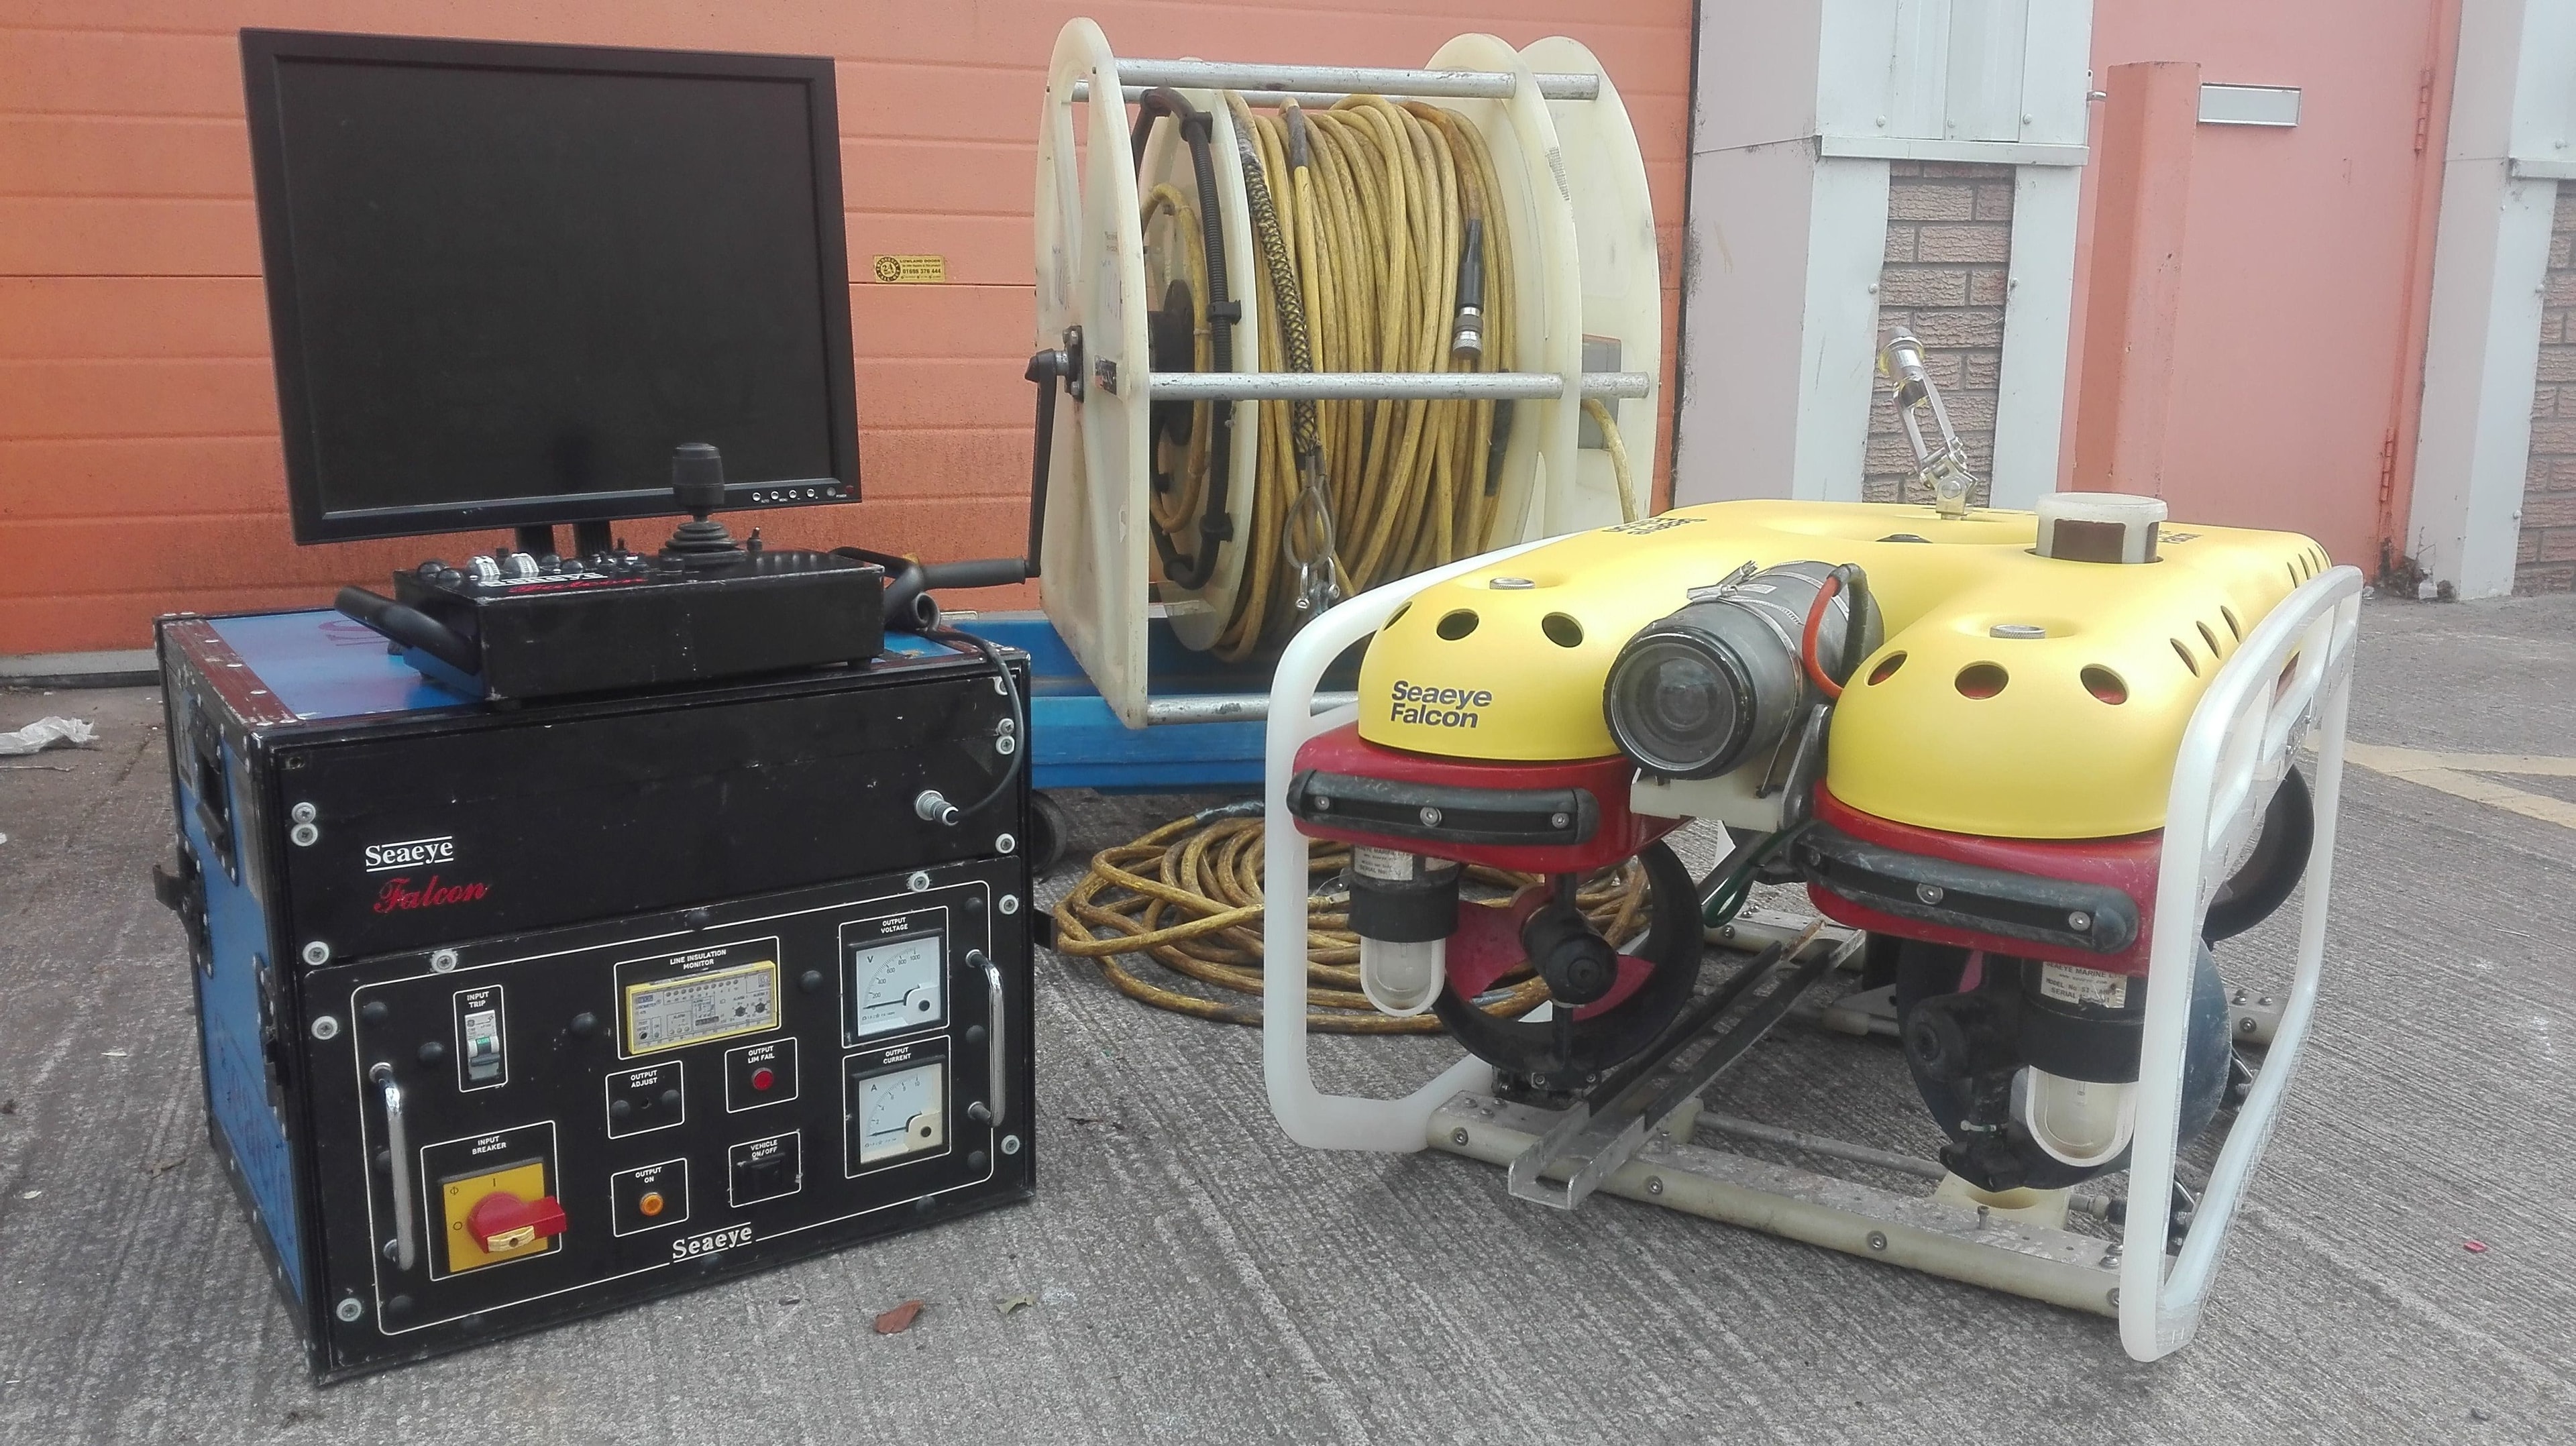
ROV-mounted CP surveys use a silver/silver chloride reference electrode on a trailing probe. The ROV pilot moves the probe to within 300 mm of the structure surface at each measurement point, and the reading is logged with position, depth, and timestamp. A systematic grid pattern ensures full coverage of the inspection area.
Modern CP survey systems can log readings at 1 Hz or faster, producing a dense dataset that can be plotted as a potential map over the structure geometry. Areas of under-protection are immediately visible as warm-coloured zones on the map.
Interpreting the Results
A CP survey report should include a potential map, a statistical summary of readings, identification of any areas outside the protection range, and an assessment of anode consumption. Anode consumption is estimated from visual inspection of anode dimensions and compared against the design depletion rate.
Findings should be compared against the previous inspection to identify trends. A structure with adequate CP readings today but rapidly depleting anodes may require intervention before the next scheduled inspection.
Part 2: Ultrasonic Thickness Measurement (UTM) Surveys
Ultrasonic thickness measurement (UTM) surveys complement CP data by directly quantifying the remaining wall thickness of structural members, pipelines, and vessel plating. Where CP readings indicate under-protection or where visual inspection reveals coating breakdown, UTM provides the hard data needed to assess structural integrity and remaining service life.
ROV-deployed UTM probes use pulse-echo ultrasonics to measure wall thickness without requiring access to the internal surface. A piezoelectric transducer emits a high-frequency pulse through the material; the time-of-flight of the returning echo, combined with the material's acoustic velocity, gives a precise thickness reading. Modern subsea UTM tools achieve accuracies of ±0.1 mm in clean conditions.
Effective UTM surveys require surface preparation at each measurement point. Marine growth, corrosion product, and loose coating must be removed — typically by ROV-mounted brush or water jetting — before the probe is applied. Inadequate surface preparation is the most common cause of spurious or rejected readings in subsea UTM campaigns.
UTM data is reported as a grid of thickness readings mapped to the structure geometry. Minimum, maximum, and mean values are calculated for each inspection zone, and any reading below the minimum allowable thickness triggers an immediate engineering review. Trend analysis across successive surveys allows corrosion rates to be calculated and remaining life to be estimated with confidence.
Running CP and UTM as a Combined Programme
The most efficient approach is to mobilise CP and UTM surveys on the same ROV deployment. The CP survey establishes the electrochemical baseline across the full structure, identifying zones of under-protection. UTM measurements are then prioritised in those zones, along with any areas flagged by visual inspection for coating breakdown or corrosion product accumulation.
Combining both datasets in a single report allows engineers to build a complete picture of each structural zone. A zone showing under-protection on CP and wall thinning on UTM is an immediate intervention priority. A zone with under-protection but no wall loss indicates a recently degraded CP system that can be addressed on a planned schedule. This correlation eliminates the ambiguity that arises when either technique is used in isolation.
Operators who run CP and UTM as a single integrated programme consistently report lower overall inspection costs, fewer unplanned interventions, and more accurate remaining-life estimates than those who treat the two techniques as separate campaigns. The combined dataset is also the format most readily accepted by class societies and insurers when demonstrating structural integrity compliance, as it addresses both corrosion protection and wall loss within a single evidential framework.